How to evaluate construction unemployment data
9/01/2021
Why do construction companies need to understand unemployment data?
Understanding construction data is a competitive advantage for construction companies. It puts you in a position to plan ahead for your upcoming labor needs and start taking action ahead of the competition.
Construction unemployment data is free, easy to access and can put you at a competitive advantage in understanding the labor market.
Where do I find construction unemployment data?
There are a few places to find the data either the Federal Reserve Economic Data (FRED) or the Bureau of Labor Statistics. Both use the BLS data, the FRED information is presented in a format that’s easier to read. The Associated Builders and Contractors also tracks employment data and does analysis on construction employment news.
The BLS puts out their data monthly. As of the July 2021 data set, construction unemployment looks like this.
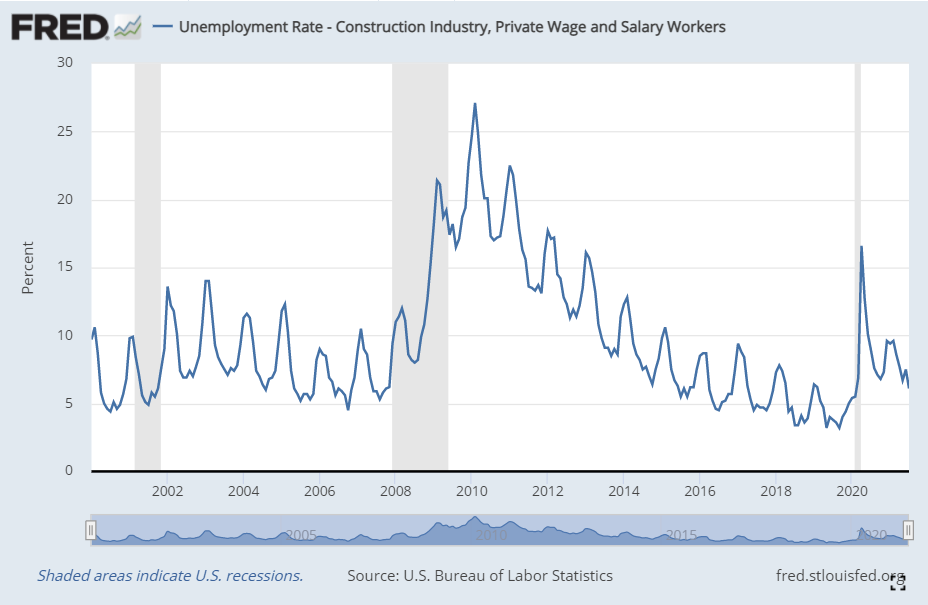
How do I evaluate construction unemployment data?
Understanding this data is about two key pieces of information and one bonus piece. The two key pieces of information are what is the overall unemployment rate currently? And second, what is the trend? The bonus information is comparing unemployed workers against the construction job openings, a topic we covered in a previous article.
Sticking to the two pieces of key information, what do we see with the data set above? First, unemployment skyrocketed when COVID hit. In April of 2020 over one million construction workers were unemployed as projects were deferred or cancelled. Second, the recovery has been dramatic. The July unemployment of 6.1% is the lowest since it was 5.5% in February 2020. This means that the construction labor recovery is well underway.
Looking back at historic unemployment data we see that labor shortages start to impact projects when unemployment is below 6% and by the time construction unemployment gets below 4% there just aren’t enough workers to fill open jobs. This means the metric that we call Total Available Construction Labor (TACL) is less than zero.
The second piece of information is what is the trend? To get this story we look to the peaks and valleys in the graph. When we see lower highs (the peaks) and lower lows (the valleys) we can see the trend is for lower unemployment. It makes sense, too given the snap back recovery of the overall economy.
As another example look at the data heading into the previous recession in 2008 and 2009. Looking at the peaks and valleys from 2006 and 2007 we an see a trend toward higher unemployment was underway. Did this data predict the recession? Not really. However, if you were running a construction company in those days these are data points that should raise a red flag.
What are the predictions for construction labor unemployment?
As we stand today in early September of 2021, the likelihood of lower unemployment over the coming months is real. Lower unemployment means a more difficult construction labor market. At Road Dog Jobs, we expect that the most dramatic impact will hit next summer as the conventional construction season hits. Construction lags the broader economy and the labor shortage that many industries are feeling today is yet to hit construction.
Please reach out to us anytime at hello@roaddogjobs.com if you have any questions or want to discuss this topic further.